
If you have ever competed in a Kaggle competition, you are probably familiar with the use of combining different predictive models for improved accuracy which will creep your score up in the leader board. While it is widely used, there are only a few resources that I am aware of where a clear description is available (One that I know of is here, and there is also a caret package extension for it). Therefore, I will try to workout a simple example here to illustrate how different models can be combined. The example I have chosen is the House Prices competition from Kaggle. This is a regression problem and given lots of features about houses, one is expected to predict their prices on a test set. I will use three different regression methods to create predictions (XGBoost, Neural Networks, and Support Vector Regression) and stack them up to produce a final prediction. I assume that the reader is familiar with R, Xgboost and caret packages, as well as support vector regression and neural networks.
The main idea of constructing a predictive model by combining different models can be schematically illustrated as below:
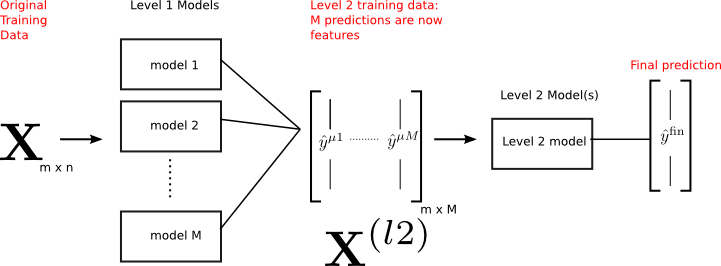
Let me describe the key points in the figure:
- Initial training data (X) has m observations, and n features (so it is m x n).
- There are M different models that are trained on X (by some method of training, like cross-validation) before hand.
- Each model provides predictions for the outcome (y) which are then cast into a second level training data (Xl2) which is now m x M. Namely, the M predictions become features for this second level data.
- A second level model (or models) can then be trained on this data to produce the final outcomes which will be used for predictions.
There are several ways that the second level data (Xl2) can be built. Here, I will discuss stacking, which works great for small or medium size data sets. Stacking uses a similar idea to k-folds cross validation to create out-of-sample predictions.
The key word here is out-of-sample, since if we were to use predictions from the M models that are fit to all the training data, then the second level model will be biased towards the best of M models. This will be of no use.
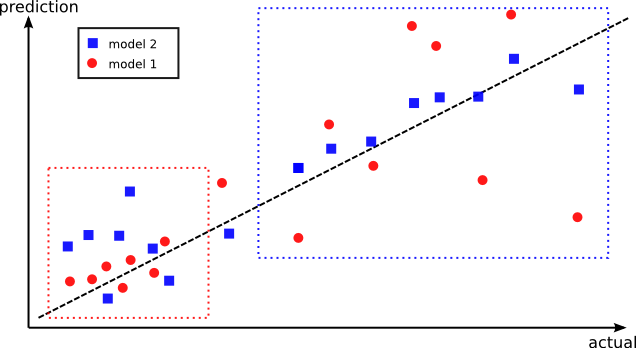
As an illustration of this point, let’s say that model 1 has lower training accuracy, than model 2 on the training data. There may however be data points where model 1 performs better, but for some reason it performs terribly on others (see figure below). Instead, model 2 may have a better overall performance on all the data points, but it has worse performance on the very set of points where model 1 is better. The idea is to combine these two models where they perform the best. This is why creating out-of-sample predictions have a higher chance of capturing distinct regions where each model performs the best.
First, let me describe what I mean by stacking. The idea is to divide the training set into several pieces like you would do in k-folds cross validation. For each fold, the rest of the folds are used to obtain a predictions using all the models 1…M. The best way to explain this is by the figure below:
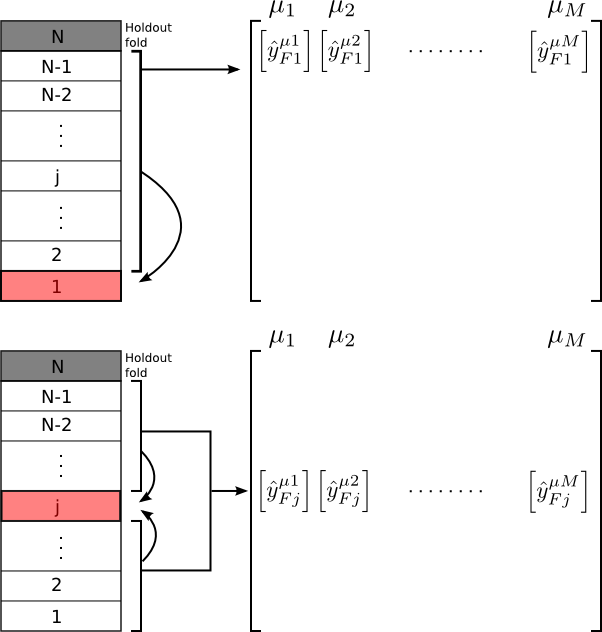
Here, we divide our training data into N folds, and hold the Nth fold out for validation (i.e. the holdout fold). Suppose we have M number of models (we will later use M=3). As the figure shows, prediction for each fold (Fj) is obtained from a fit using the rest of the folds and collected in an out-of-sample predictions matrix (Xoos). Namely, the level 2 training data Xl2 is Xoos. This is repeated for each of the models. The out-of -sample prediction matrix (Xoos) will then be used in a second level training (by some method of choice) to obtain the final predictions for all the data points. There are several points to note:
- We have not simply stacked the predictions on all the training data from the M models column-by-column to create a second level training data, due to the problem mentioned above (the fact that the second level training will simply choose the best of the M models).
- By using out-of-sample predictions, we still have a large data to train the second level model. We just need to train on Xoos and predict on the holdout fold (Nth). This is in contrast to model ensembles.
Now, each model (1…M) can be trained on the (N-1) folds and a prediction on the holdout fold (Nth) can be made. There is nothing new here. But what we do is that, using the second level model which is trained on Xoos, we will obtain predictions on the holdout data. We want that the predictions from the second level training be better than each of the M predictions from the original models. If not, we will have to restructure the way we combine models.
Let me illustrate what I just wrote with a concrete example. For the case of the House Prices data, I have used 10 folds of division of the training data. The first 9 is used for building Xoos, and 10th is the holdout data for validation. I trained three level 1 models: XGBoost, neural network, support vector regression. For level 2, I used a linear elasticnet model (i.e. LASSO + Ridge regression). Below are the root-mean-squared errors (RMSE) of each of the models evaluated on the holdout fold:
XGBoost :0.10380062
Neural Network: 0.10147352
Support Vector Regression: 0.10726746
Stacked: 0.10005465
As clear from this data, the stacked model has slightly lower RMSE than the rest. This may look too small of a change, but when Kaggle leaderships are involved, such small differences matter a lot!
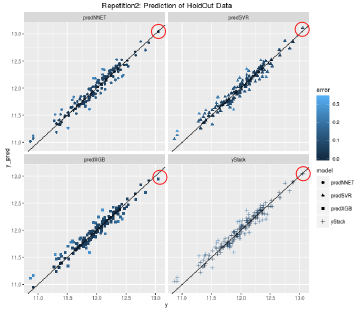
Graphically, once can see that the circled data point is a prediction which is worse in XGBoost (which is the best model when trained on all the training data), but neural network and support vector regression does better for that specific point. In the stacked model, that data point is placed close to where it is for neural network and support vector regression. Of course you can also see some cases where using just XGboost is better than stacking (like some of the lower lying points). However, the overall predictive accuracy of the stacked model is better.
One final complication that will further boost your score: If you have spare computational time, you can create repeated stacks. This will further reduce the variance of your predictions (something reminiscent of bagging).
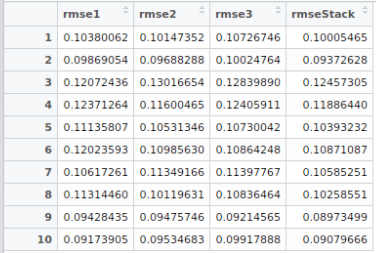
For example, let’s create a 10 folds stacking not just once, but 10 times! (say by caret’s createMultiFolds function). This will give us multiple level 2 predictions, which can then be average over. For example, below are the RMSE values on the holdout data (rmse1: XGBoost, rmse2: Neural Network, rmse3: Support Vector Regression), for 10 different random 10-folds created. Averaging the final predictions from the level 2 predictions on these Xoos’s (i.e. Xoos from stack1, Xoos from stack2, …, Xoos from stack10), would further improve your score.
Once we verify that stacking results in better predictions than each of the models, then we re-run the whole machinery once again, without keeping Nth fold as holdout data. We create Xoos from all the folds, and the the second level training uses Xoos to predict the test set which Kaggle provides us with. Hopefully, this will creep your score up in the leader board!.
Final word: You can find the scripts from my Github repo.
Note: If you have a classification problem, you can still use the same procedure to stack class probabilities.
Edit January 2019: I have built a Python package which provides a simple API for stacking.

Thanks for the post Burak – really informative! I wanted to clarify one points though – looking at the last table you included, you describe it as:
‘RMSE values on the holdout data (rmse1: XGBoost, rmse2: Neural Network, rmse3: Support Vector Regression), for 20 different random 10-folds created.’
I don’t see how the the table is showing results ‘for 20 different random 10-folds’, these must have been averaged/combined somehow in order to generate these level 2 predictions – right?
Would really appreciate your thoughts on this 🙂
LikeLiked by 1 person
I am glad you enjoyed reading the post! You actually caught a typo in the blog post! It should be “10 different random 10-folds” not 20. So the table shows the results for 10 different folds. I have corrected this typo now. Thank you for carefully reading the post!
LikeLiked by 1 person
ah thanks for clarifying! Just a quick follow-up question – did you try averaging the final predictions from the level 2 predictions on those Xoos’s, to see if it improved the score?
LikeLike
Yes, I tried averaging. In this case, a simple average (or a weighted average) does slightly worse than training a second level model. However, it should be the first thing to do before trying a second level model. In competitions, people sometimes use ~100 models (things like boosted trees with different initial random seeds), so my feeling is that a second level model works better than just averaging.
LikeLike
Thanks. This one is one of the best explanation on stacking with example.
Have you created Kaggle kernel for this as well?
LikeLike
Thanks, I am glad you found it useful. I did not create a kernel, since the whole workflow takes a while to run and the kernel exists before completion.
LikeLike
Was the improvement in score due to stacking reflected in the public leaderboard? Currently, I am participating in a competition, where the stacking is giving more 10-fold and 5-fold cv accuracy than the individual models, but is giving low accuracy on the public leaderboard. Should I rely on the stacked solution?
LikeLike
I was able to beat my own score, but it wasn’t very high on the leader board to start with. There are a few reasons for that. The most important one is that I did not engineer my features optimally. This is always the most important and time consuming step. After the features are optimized (which could be done separately for each model that you eventually want to stack), then stacking is useful.
My suggestion would be to start with one of the kernels which score high on the public leader board. Take the features from that kernel, and try to engineer them further for a higher score. Once you reach your best score, then try to stack models. The winning solutions have a very large number of models (about 100), most of which can be very similar (e.g. xgboost with different starting random seeds). Finding the best stacked solution can also be time consuming, since you may need to throw away some solutions that would actually reduce your score (it happens as you have observed).
LikeLike
Hi I am still confused about this process and the diagrams above. Suppose I have a data set and I split into 2 folds. Assume also I only have **three** models for stage 1 and **one** model for stage 2.
1st iteration – train on Fold1 and Predict Fold2
2nd iteration – train on Fold2 and Predict Fold1
Now what do I do with the Predict Fold2 and Predict Fold1 data? I am not clear how to do the stacking here.
LikeLike
If I understood what you are doing correctly, then the next step would be to train a new model on the data which is a combination of Predict Fold 1 and Predict Fold 2.
LikeLike
Hi ! From this part : “Once we verify that stacking results in better predictions than each of the models, then we re-run the whole machinery once again, without keeping Nth fold as holdout data.” => I see two options here.
1) I use the previous holdout as a regular fold, during the re-run (this adds up a new fold)
2) Or I use the same number of fold but the previous holdout is distributed among the previous fold
Wich options would you think is the best ?
Also thanks a lot for this article, it is by far the best i’ve read on stacking so far !
LikeLike
Hi Pierre,
Glad you found the post useful.
From what I understand, I think the 1st option is closer to what I wrote in the post.
LikeLike
But once we have trained the models with the holdout fold, why do we need to train again without holdout fold, rather than simply performing prediction on the test set provided by Kaggle?
LikeLike
Sorry for the late reply. You can do that, however I think it would be better to use the whole data once parameters of stacking is obtained for the final fit.
LikeLike